► New car sales analysis 2018
► How many cars were sold in UK
► Who’s up, who’s down?
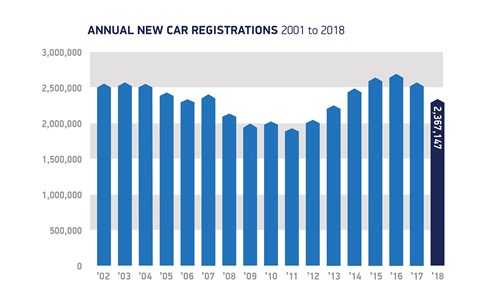
The UK’s new car market contracted by 7% in 20187, as buyers held on to their cars for longer and resisted upgrading to a new model, figures out today show. Some brands – led by DS, Infiniti and Nissan – suffered major sales slumps and all but 10 manufacturers posted a decline on the previous year.
A total of 2.37 million cars were registered last year, according to the full-year figures published by the Society of Motor Manufacturers and Traders (SMMT) this morning. Private retail sales fell by 6.4%, but fleet buyers were less active, with a 7.3% drop in corporate new-car sales.
2019 UK new car sales analysis
Consumer confidence has weakened, fears over Brexit and the economy have deterred buyers and the ongoing confusion over diesel’s role has further eroded new-car sales, according to the SMMT. Sales of diesel vehicles continued to collapse, falling by a further 30% in 2018 to 750,165 vehicles.
To put that in perspective, 316,000 fewer oil-burners were sold last year compared with the year before. By comparison, sales of petrol cars rose by 8.7% while registrations of alternative fuelled vehicles (hybrids, plug-ins and pure electric cars) leaped by 21%. Today 6% of all registrations are electrified in some shape or form.
Should you buy a diesel car in 2019?

Although disappointing, it’s worth noting that registrations in 2018 are still historically high, coming off the back of two years of record sales in 2015 and 2016 (see SMMT chart above).
New car sales 2018: reaction
‘The figures are not exactly brilliant,’ admitted Mike Hawes, the head of the SMMT. ‘It was a turbulent year.’
However, despite the ongoing uncertainty, the SMMT is predicting a relatively steady year for new-car sales in 2019, with only a slim 2% decline. However, bosses fear that could slip further if Britain crashes out of the EU without a deal.

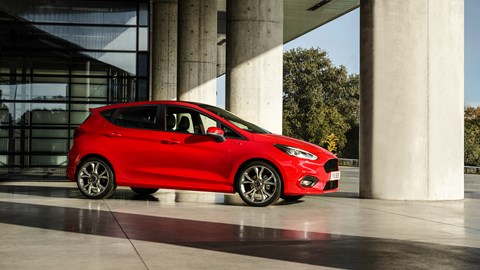
The Ford Fiesta (above) remains the UK’s bestselling car, but there are other trends we can pick out from analysing the sales charts.
Revealed: the top 10 bestselling cars in Britain in 2018
The usual names are scattered throughout the top 10 – with some of the bestselling nameplates throughout. Note how three of the top 10 are crossovers (Qashqai, Kuga, Sportage) and how premium products such as Mini and the Mercedes-Benz A-Class are becoming more popular.
- Ford Fiesta 95,892
- VW Golf 64,829
- Vauxhall Corsa 52,915
- Nissan Qashqai 50,546
- Ford Focus 50,492
- VW Polo 45,149
- Mini 44,904
- Mercedes A-Class 43,527
- Ford Kuga 40,398
- Kia Sportage 35,567
Noticeable drop-outs from last year include the Vauxhall Astra and Mercedes-Benz C-Class.
Read on to see which brands are up and which are down, as we analyse the UK’s 2018 new-car sales figures in detail.
Winners and losers: Britain’s new-car registrations 2018
The SMMT figures reveal exactly which brands are up and which are down, with big rises for some, but rather more red ink at others.
The only brands posting increases in 2018 can be counted on two hands:
- Abarth (+26.8%) Small, spicy cars in vogue
- Jaguar (+4.2%) Belated move into SUVs proves a wise move
- Kia (+2.7%) Continued product push at scale paying dividends
- Mazda (+1.3%) Strong line-up sold with low APR proves tempting
- McLaren (+10.4%) Ever more niches being filled is paying off
- MG (+103.8%) Haven’t you noticed all those SUVs on the roads?
- Mitsubishi (+31.5%) Reliance on SUVs and PHEVs a smart move
- Seat (+12%) Ateca and Arona doing well, piggybacking VW strategy
- Subaru (+17.3%) 4×4 toughery bouncing back from years of decline
- Volvo (+9.1%) Strongest line-up in years and SUVs galore appealing
But there was red ink for everyone else, including some major falls for DS (whose sales nearly halved to 5074 units, down from 9082 a year earlier), Infiniti (which suffered a 79% collapse, as UK sales nosedived from 3515 to 750) and Nissan (down a full 50,000 units to 102,637). It just goes to show how tough it is to sell cars in a marketplace obsessed with snobbish badge appeal.
Top tip for smartphone users: flip your device to widescreen to see the full table:
| Marque |
2018 sales |
% market share |
2017 sales |
% market share |
Up or down? |
| Abarth |
5631 |
0.24 |
4441 |
0.17 |
+26.8% |
| Alfa Romeo |
4161 |
0.18 |
4997 |
0.20 |
-16.7% |
| Alpine |
142 |
0.01 |
0 |
0.00 |
0.00 |
| Aston Martin |
1455 |
0.06 |
1471 |
0.06 |
-1.1% |
| Audi |
143,739 |
6.07 |
174,982 |
6.89 |
-17.9% |
| Bentley |
1542 |
0.07 |
1753 |
0.07 |
-12.0% |
| BMW |
172,048 |
7.27 |
175,101 |
6.89 |
-1.7% |
| Chevrolet |
41 |
0.00 |
70 |
0.00 |
-41.4% |
| Citroen |
49,618 |
2.10 |
51,455 |
2.03 |
-3.6% |
| Dacia |
24,169 |
1.02 |
25,149 |
0.99 |
-3.9% |
| DS |
5074 |
0.21 |
9082 |
0.36 |
-44.1% |
| Fiat |
35,652 |
1.51 |
44,475 |
1.75 |
-19.8% |
| Ford |
254,082 |
10.73 |
287,396 |
11.31 |
-11.6% |
| Honda |
52,570 |
2.22 |
53,901 |
2.12 |
-2.5% |
| Hyundai |
89,925 |
3.80 |
93,403 |
3.68 |
-3.7% |
| Infiniti |
750 |
0.03 |
3,515 |
0.14 |
-78.7% |
| Jaguar |
37,019 |
1.56 |
35,544 |
1.40 |
+4.2% |
| Jeep |
6114 |
0.26 |
6380 |
0.25 |
-4.2% |
| Kia |
95,764 |
4.05 |
93,222 |
3.67 |
+2.7% |
| Land Rover |
77,906 |
3.29 |
82,653 |
3.25 |
-5.7% |
| Lexus |
12,405 |
0.52 |
12,670 |
0.50 |
-2.1% |
| Lotus |
247 |
0.01 |
279 |
0.01 |
-11.5% |
| Maserati |
1297 |
0.05 |
1701 |
0.07 |
-23.8% |
| Mazda |
39,602 |
1.67 |
39,092 |
1.54 |
+1.3% |
| McLaren |
626 |
0.03 |
567 |
0.02 |
+10.4% |
| Mercedes-Benz |
172,238 |
7.28 |
180,970 |
7.12 |
-4.8% |
| MG |
9049 |
0.38 |
4441 |
0.17 |
+103.8% |
| Mini |
67,021 |
2.83 |
68,166 |
2.68 |
-1.7% |
| Mitsubishi |
21,156 |
0.89 |
16,092 |
0.63 |
+31.5% |
| Nissan |
102,637 |
4.34 |
151,156 |
5.95 |
-32.1% |
| Peugeot |
81,043 |
3.42 |
82,226 |
3.24 |
-1.4% |
| Porsche |
12,437 |
0.53 |
14,051 |
0.55 |
-11.5% |
| Renault |
62,168 |
2.63 |
69,110 |
2.72 |
-10.0% |
| Seat |
62,863 |
2.66 |
56,130 |
2.21 |
+12.0% |
| Skoda |
74,724 |
3.16 |
79,758 |
3.14 |
-6.3% |
| Smart |
7631 |
0.32 |
10,323 |
0.41 |
-26.1% |
| Ssangyong |
2754 |
0.12 |
3590 |
0.14 |
-23.3% |
| Subaru |
3141 |
0.13 |
2679 |
0.11 |
+17.3% |
| Suzuki |
38,519 |
1.63 |
40,343 |
1.59 |
-4.5% |
| Toyota |
101,922 |
4.31 |
101,985 |
4.01 |
-0.1% |
| Vauxhall |
177,298 |
7.49 |
195,137 |
7.68 |
-9.1% |
| VW |
203,133 |
8.58 |
208,462 |
8.21 |
-2.5% |
| Volvo |
50,319 |
2.13 |
46,139 |
1.82 |
+9.1% |
| Other British |
723 |
0.03 |
700 |
0.03 |
+3.3% |
| Other Imports |
4792 |
0.20 |
5860 |
0.23 |
-18.2% |
| Total |
2,367,147 |
|
2,540,617 |
|
-6.8% |